
Key Takeaways
Good gearbox vibration diagnosis combines sound measurement practice with knowledge of how the machine operates. The aim is not simply to find a high reading, but to connect a changing pattern with a likely mechanical cause and a sensible maintenance response.
- Establish a baseline while the gearbox is operating normally.
- Record speed, load, temperature, lubrication, and measurement conditions.
- Use time waveform, spectrum, trend, phase, and envelope data together when appropriate.
- Distinguish gear, bearing, alignment, imbalance, looseness, and resonance patterns.
- Confirm the diagnosis before choosing lubrication, repair, replacement, or continued monitoring.
Understand the fundamentals of gearbox vibration
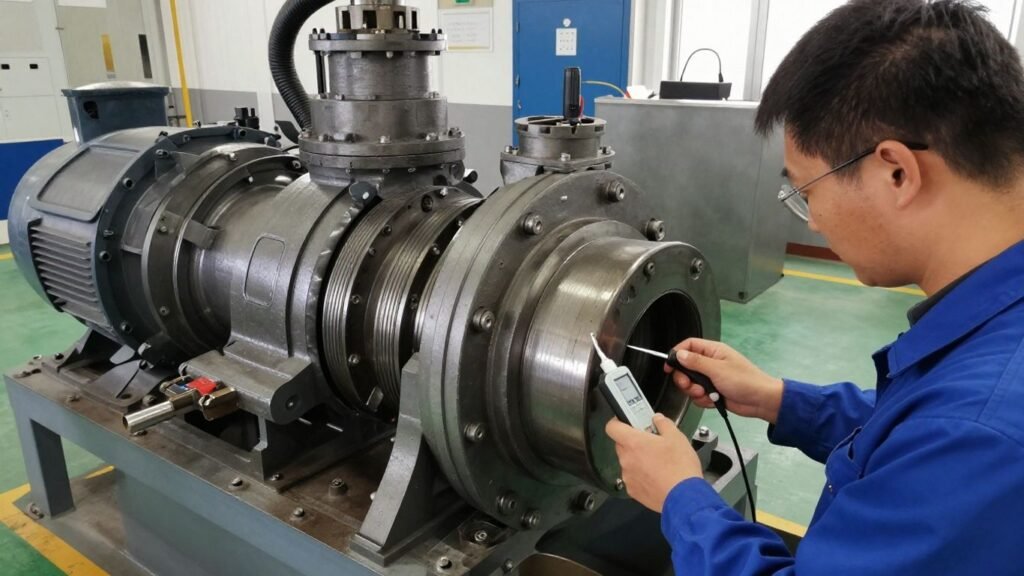
A gearbox changes speed and torque through several interacting mechanical parts. Each gear pair, shaft, bearing, and coupling contributes motion to the casing, while the connected machine adds its own forces. Understanding that mechanical context makes a vibration reading far more useful than an isolated amplitude value. A general overview of gearbox functions and configurations can be found in this gearbox vibration analysis guide.
How gears, shafts, bearings, and loads create vibration
Meshing teeth create a repeating force each time they engage, and rotating shafts transmit that force through bearings and housings. Load changes alter tooth contact pressure, while shaft flexibility and coupling conditions affect how energy travels through the machine. A bearing may add small impacts, and a loose support can amplify otherwise ordinary forces. The measured signal is therefore a combined response, not a direct recording of one component alone.
The difference between normal and abnormal vibration
Every operating gearbox vibrates. Normal vibration tends to remain stable for a known speed and load, with repeatable spectral features and no associated change in temperature, noise, or process behavior. Abnormal vibration usually appears as a rising trend, a new frequency, stronger modulation, or a pattern that changes unexpectedly. A changing pattern matters most when deciding whether a reading deserves investigation.
Key vibration frequencies and what they reveal
Analysts commonly compare running speed, gear mesh frequency, harmonics, sidebands, and bearing-related frequencies. Running-speed components can point toward imbalance, misalignment, or looseness, while gear mesh activity reflects tooth engagement and its surrounding modulation. Bearing frequencies often become more visible in higher-frequency or enveloped data. Frequency identification narrows the possibilities, but it does not replace inspection and operating context.
Why operating conditions affect diagnostic results
A reading taken at light load may look very different from one taken near rated torque. Speed shifts frequency locations, temperature changes lubricant behavior and clearances, and process transients can create short-lived peaks. For that reason, compare like with like whenever possible. If conditions differ, record the difference rather than treating the measurements as directly equivalent.
Recognize common gearbox fault symptoms
Gearbox faults rarely announce themselves through one symptom alone. Vibration may rise before a visible defect appears, but sound, heat, oil condition, and process performance can add valuable evidence. The most reliable diagnosis comes from combining these clues and asking whether they agree with the suspected failure mode.
Identifying gear tooth wear, pitting, and cracking
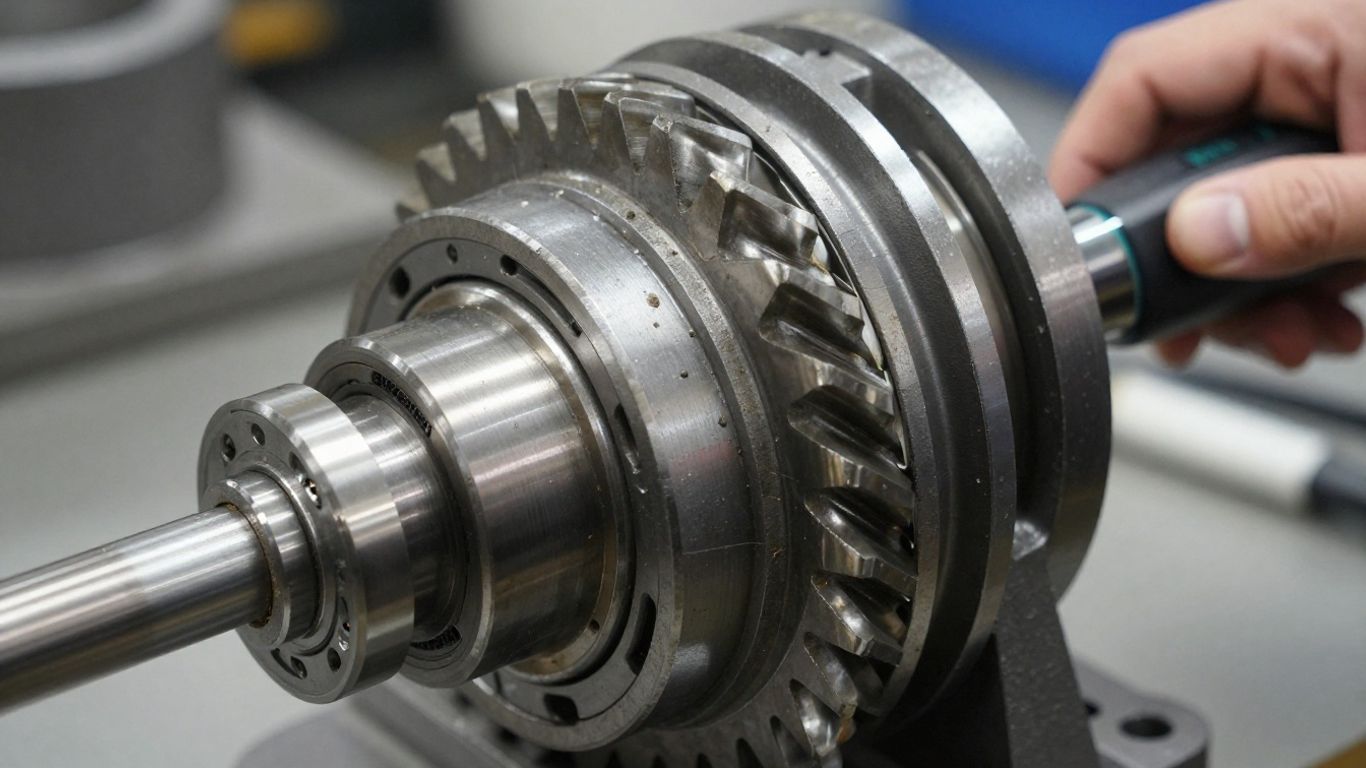
Wear can increase gear mesh energy and produce sidebands around the mesh frequency, especially as tooth profiles lose their regular contact. Pitting may create sharper impacts, while a cracked or damaged tooth can generate a once-per-revolution disturbance that repeats as the damaged tooth enters mesh. Inspecting tooth surfaces, backlash, and debris in the lubricant helps separate progressive wear from a more localized defect.
Detecting bearing defects and lubrication problems
Bearing damage often produces impulsive vibration that becomes clearer with high-frequency measurements or envelope analysis. Poor lubrication can increase friction and temperature before a major defect develops, while contamination may accelerate surface damage. Check lubricant level, grade, cleanliness, and delivery path alongside the vibration data. A high reading without lubrication context can lead to the wrong repair.
Distinguishing shaft misalignment from imbalance
Imbalance is commonly tied closely to running speed and often changes with rotational speed. Misalignment may produce running-speed harmonics, axial vibration, coupling stress, and elevated readings at both connected machines. The distinction is not always clean, particularly when soft foot, bent shafts, or loose mounts are also present. Phase measurements and alignment checks can help identify which force is dominant.
Connecting noise, heat, and vibration to failure risk
A new growl, rattling sound, hot bearing housing, oil odor, or visible leakage raises the urgency of a vibration finding. These signs do not prove a particular defect, but they indicate that the machine deserves prompt attention rather than a routine future check. A practical early-fault discussion also appears in this gearbox fault detection resource, while the final decision should reflect the machine’s duty and consequences of failure.
Prepare for accurate vibration measurements
A good diagnosis begins before the analyzer is switched on. Sensor choice, mounting consistency, frequency range, and operating records all shape the quality of the result. Small procedural differences can obscure a slow fault trend, so repeatability is as valuable as technical sophistication.
Choosing sensors, mounting points, and measurement directions
Use an appropriate accelerometer or velocity sensor and mount it firmly on a clean, structurally connected surface. Measure in consistent horizontal, vertical, and axial directions at points close to bearings or other load paths. Avoid thin guards, painted surfaces, flexible brackets, and hand-held positioning when a repeatable route is required. Marking points and directions makes future comparisons much more trustworthy.
Selecting frequency ranges, sampling rates, and units
The selected frequency range should include the suspected fault frequencies and enough surrounding bandwidth to show harmonics or sidebands. Sampling must be fast enough to capture the highest frequency of interest without aliasing, and the chosen unit should remain consistent across the monitoring program. Velocity may be useful for broad machine severity, while acceleration can reveal shorter-duration, higher-frequency events.
Recording speed, load, temperature, and lubrication data
Every measurement should carry enough context to explain why it may differ from the previous one. Record shaft speed, gearbox load, oil temperature, ambient conditions, lubricant state, and any recent process or maintenance change. A condition-monitoring platform such as System 1 Evo is described as collecting, analyzing, and visualizing complex gearbox data; regardless of the tool, the underlying records still need to be accurate and comparable.
Avoiding common measurement and data-quality errors
Loose sensors, inconsistent points, incorrect tachometer settings, insufficient averaging, and missing speed data are frequent sources of misleading results. Repeat a surprising measurement before assigning a fault label. A simple route checklist can keep the collection process disciplined:
- Confirm the sensor, cable, and mounting condition.
- Verify speed and load against the operating record.
- Measure the same point and direction used previously.
- Check for clipping, overload, noise, or an implausible spectrum.
After the route, review the files while the machine context is still familiar. A clean dataset makes later trend comparisons faster and reduces the temptation to explain an artifact as a mechanical defect.
Follow a gearbox vibration diagnosis workflow
A practical workflow moves from known conditions toward increasingly specific evidence. Begin with history and baseline data, then compare multiple signal views before testing a fault hypothesis. The process should also include physical confirmation, because vibration analysis is strongest when it agrees with what the machine is doing.
Establishing a reliable baseline during normal operation
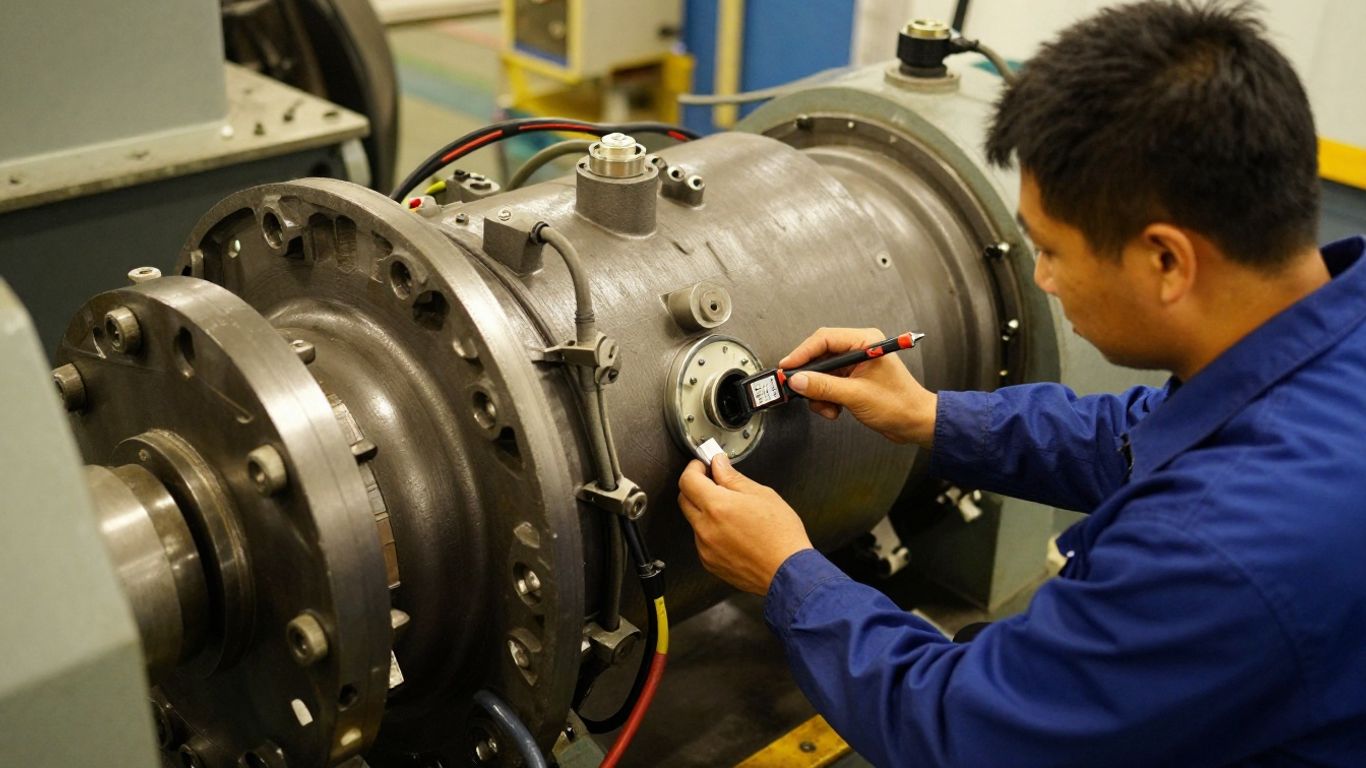
Collect baseline readings after the gearbox has reached normal temperature and stable operating conditions. Capture more than one load or speed state when the machine routinely operates across a range. Note recent repairs and the lubricant condition, since a “normal” reading immediately after maintenance may not be representative of long-term behavior. The baseline becomes the reference for both alarms and human judgment.
Comparing time waveform, spectrum, and trend data
The time waveform shows impacts and repeating events that may be hidden in an averaged spectrum. The spectrum identifies frequency relationships, while trend data reveals whether the condition is stable, intermittent, or worsening. Read them together: a peak that looks concerning in one view may be ordinary when its time behavior and historical trend are considered. This layered comparison is central to gearbox vibration diagnosis.
Using phase analysis and envelope detection when appropriate
Phase can help distinguish force direction and separate imbalance from misalignment or structural response. Envelope detection can bring repetitive bearing impacts into view when ordinary spectrum data is dominated by lower-frequency gear activity. Neither technique is automatically necessary for every reading. Use it when the initial evidence suggests a particular question that the additional analysis can answer.
A short visual demonstration can be useful when training a team, but it should support—not replace—the machine’s own measurements and history.
Confirming suspected faults with visual and operational checks
Once a pattern suggests a fault, inspect accessible teeth, seals, couplings, mounts, and lubricant samples. Listen for changes, check housing temperature, review recent process events, and ask operators when the symptom first appeared. If the suspected defect is serious, follow site safety and shutdown procedures before opening the equipment. Confirmation turns a plausible interpretation into a defensible maintenance recommendation.
Interpret gearbox vibration patterns
Patterns are more informative than isolated peaks. Their location, spacing, modulation, phase, and response to speed or load can reveal how energy is being generated and transmitted. Interpretation still requires restraint: several faults can produce similar signatures, and resonance can magnify a small excitation.
Recognizing gear mesh frequency and sideband patterns
Gear mesh frequency is related to the number of teeth and rotational speed of the gear. A clean mesh component may be normal, whereas multiple evenly spaced sidebands can indicate modulation from a damaged tooth, eccentricity, or a shaft-related disturbance. Watch whether the sidebands grow with load and whether the time waveform contains a matching repeatable event. The pattern’s relationship to shaft speed often matters as much as its amplitude.
Analyzing bearing fault frequencies and modulation
Bearing-related frequencies depend on geometry, rolling-element count, contact angle, and shaft speed. Defects may first appear as weak, high-frequency impacts before producing obvious low-frequency vibration. Envelope spectra can expose the repetition rate, while a rising broadband level may indicate worsening surface damage or lubrication trouble. Verify the bearing arrangement and calculated frequencies before naming the defect.
Separating looseness, resonance, and structural vibration
Mechanical looseness may create harmonics, impacts, or a broad collection of running-speed components. Resonance, by contrast, can sharply amplify a forcing frequency over a narrow speed range, even when the original mechanical force is modest. Structural vibration may come from the gearbox support, base, piping, or connected equipment. A physical inspection and a controlled speed change can help separate these possibilities.
Evaluating changes across speed and load conditions
A defect tied to gear contact often responds to torque, while an imbalance component typically follows speed more directly. Resonance may appear only within a particular speed band, and looseness can become more obvious as load direction changes. Build a small operating map when safe: compare repeatable readings at selected conditions rather than relying on one snapshot.
Turn diagnostic findings into maintenance decisions
Diagnosis has value only when it leads to a proportionate action. A high reading may call for immediate intervention, closer monitoring, or simply better data, depending on the pattern and the machine’s role. Maintenance teams should combine evidence, consequence, access, spare availability, and safe operating limits.
Ranking faults by severity and failure risk
Rank findings by evidence strength, rate of change, likely damage mechanism, and consequence if the gearbox stops or fails violently. A stable, low-level feature may remain on a watch list, while a rapidly rising impact pattern with heat and debris deserves urgent planning. Define escalation thresholds in advance so decisions are not made solely under production pressure.
Choosing between lubrication, alignment, repair, and replacement
Correct lubrication problems only when the lubricant, quantity, delivery, and contamination issue are understood. Alignment work is appropriate when phase, coupling behavior, and inspection support that conclusion. Gear or bearing damage may require repair or replacement, but the scope should follow confirmed condition rather than an alarming number alone. For perspective on disciplined routine planning outside rotating equipment, see this exercise routine guide and its emphasis on consistent progression; the same principle applies here without making the subjects interchangeable.
Verifying repairs with follow-up vibration measurements
Repeat the same measurements after the repair under comparable speed, load, and temperature. Confirm that the targeted frequency or trend has changed, and check that a new problem was not introduced through incorrect assembly, alignment, or lubrication. Keep before-and-after spectra and time waveforms with the work order. Verification closes the loop and provides a stronger baseline for the next route.
Building a condition-monitoring program for recurring analysis
A useful program assigns assets by risk, defines routes and intervals, standardizes measurement points, and records decisions. It also gives analysts a way to review recurring patterns rather than starting from zero after every alarm. Portable lighting may help technicians inspect dark equipment areas; for example, the Carry 3 is documented as an all-in-one telescopic light. That accessory does not diagnose vibration, but clear visual access can make an inspection more practical.
A compact decision record keeps the process consistent across shifts. Include the observed pattern, operating state, suspected cause, confidence level, recommended action, deadline, and follow-up result. For equipment with high business or safety consequences, this record should connect condition findings to the site’s work-management and risk procedures.
The same care applies when comparing vibration with broader equipment health or personal factors: a cardiovascular health guide may discuss warning signs in a medical context, but it should not be used to interpret machinery data. Keeping evidence in its proper domain prevents confident conclusions from weak analogies. Likewise, a touring eBike is a different mechanical system entirely, even though it also contains rotating components.
Conclusion
Gearbox vibration diagnosis is a disciplined comparison of signals, operating conditions, machine history, and physical evidence. Establish a reliable baseline, interpret patterns rather than isolated peaks, confirm the likely cause, and verify every repair with follow-up measurements. That approach catches developing faults earlier while reducing unnecessary intervention.
Frequently Asked Questions
What is gearbox vibration diagnosis?
It is the process of measuring and interpreting vibration from a gearbox to identify developing mechanical problems such as gear damage, bearing defects, imbalance, misalignment, looseness, or resonance.
What vibration symptoms suggest a gearbox fault?
Common warning signs include a rising trend, new harmonics or sidebands, repetitive impacts, unusual noise, increased housing temperature, lubricant contamination, and changes that persist under comparable operating conditions.
Which sensor is best for gearbox measurements?
The right sensor depends on the machine, frequency range, mounting location, and diagnostic goal. Accelerometers are often useful for higher-frequency events, while velocity measurements can support broader machine-severity assessment.
How often should gearbox vibration be measured?
The interval should reflect asset criticality, fault development speed, operating variability, and available history. High-risk or rapidly changing equipment may need more frequent routes than stable, low-consequence assets.
Can vibration analysis identify a cracked gear tooth?
It can provide evidence through repeating impacts, sidebands, and gear-mesh changes, but the result should be confirmed with inspection or other operational evidence before repair decisions are finalized.
Why must speed and load be recorded?
Speed shifts frequency locations and load changes tooth forces, clearances, and structural response. Without that context, two valid readings may appear inconsistent or a normal operating change may be mistaken for deterioration.
What should happen after a suspected fault is found?
Assess severity and consequences, inspect the equipment safely, choose a proportionate maintenance action, and repeat the vibration measurements afterward under comparable conditions to verify the result.